| Living things & the processes of life - The processes of life - The Human Body & Reproduction - G17 |
  Teacher's Guide Teacher's Guide
LT-D2.1 |
|
1. See notes in LT-C2.3 for description of the lungs. This might be a good time to talk about the dangers of smoking and how it reduces your lung efficiency. Worksheet D23 (G) can be used for the children to complete a flowchart of the role of the lungs. |
|
Teachers should check with their local authority Health and Safety officer on the recommended use of appliances such as peak flow meters in their schools.
A peak flow meter measures the air flowing out of the lungs.
Peak flow zones are based on the traffic light concept: red means concern, yellow means caution, and green means safe. These zones are different for each person. The three peak flow zones include: Green Zone: 80 - 100% of personal best Yellow Zone: 50 - 79% of personal best Red Zone: less than 50% of personal best |
|
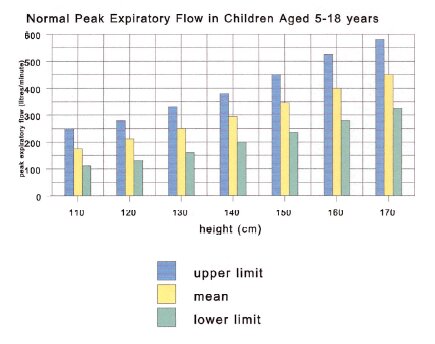
Green: This is the GO zone! This zone is from 80 to 100 percent of a person’s highest peak flow reading. This is the zone one should be in every day. This is a signal that air moves well through the large airways and that a person can do the usual activities and go to sleep without trouble. Yellow: This is the CAUTION or SLOW DOWN zone! This zone is from 50 to 80 percent of a person’s highest peak flow reading. This is a clue that the large airways are starting to narrow. A person may begin to have mild symptoms. There may be coughing, feeling tired, feeling short of breath, or feeling like the chest is tightening. A person’s individual self-management plan should be consulted at this point. Continual use of the preventative medication as a doctor may have ordered is recommended. Asthma triggers should be avoided. Red: This is the STOP or CONCERN zone! This zone is less than 50 percent of a person’s highest peak flow reading. Readings in this zone may be of concern. If a person has not already checked their individual self- management plan, they should do so now. There may be increased narrowing of the large airways and a person may now be coughing, very short of breath, wheezing both when breathing in and out, or having retractions. Urgent action may be required. Peak Flow Meters are available from Hope Education (http://www.hope-education.co.uk) A graph of normal peak flow ranges is shown below:- |
 |
|
Extension Activities for Peak Flow readings Look at the graphs (charts) below and answer the questions that accompany each graph.
1. In Chart A, you should see a pattern. Can you say what the pattern appears to be? 2. This graph, Chart B, shows the peak flow results from a person working in a dusty environment. What do you notice about the peak flow readings? 3. This graph, Chart C, shows a person’s peak flow readings taken before and after medication. What two signs may show that this medication is working? 4. This graph, Chart D, shows peak flow readings taken before and after a person caught a cold. What has been the effect of the cold on the person’s peak flow readings? |
|
Using Peak Flow Meters Method:
Questions: What differences do you notice in your results? Using the Chart A, on the page above, answer the following questions. This shows a series of readings made for one person over several days. You are going to see if you can see any patterns in these results. 1. How many days were peak flow readings taken for? 2. How many readings were taken each day? 3. What is the highest reading? 4. What is the lowest reading? 5. What general trend does this person appear to show each day? |


 What are peak flow zones?
![]()